Project Overview
As the primary intern on this project, I navigated the development of the web application from start to finish, working closely with occupational therapists to ensure the design aligned with their needs. The application provides a platform for therapists to analyze data from sensors placed within the SmartSeat, helping them monitor patient movements and assess the physical health of older adults in real-time.
I managed every stage of the process—from the initial design discussions to implementing the frontend interface. Additionally, I built and integrated backend API endpoints, enabling seamless data storage and retrieval in collaboration with InfluxDB. This system allows for smooth communication between the dashboard and the backend, ensuring data can be created, read, updated, and deleted (CRUD) effectively.
Throughout the project, I worked independently, taking ownership of both the frontend and backend tasks. My role involved coordinating the technical aspects and ensuring that the dashboard met the expectation of the end users (occupational therapists).
Role: Full-Stack Developement Reasearch Intern
Time Frame: May 2024 - Present
Tech Stack/Skills: ReactJS, Flask, Python, InfluxDB, HomeAssistant, Firebase, Grafana, Figma
Features
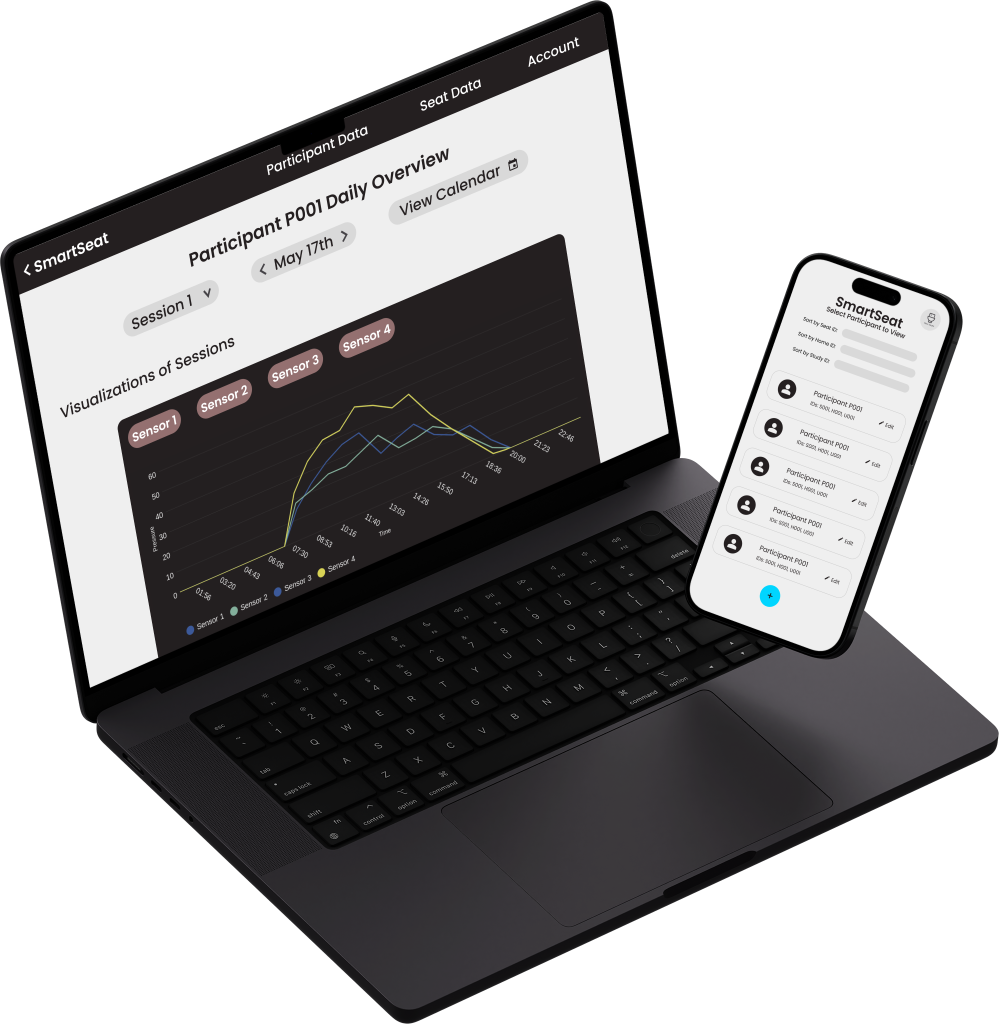
The project uses a login-based system powered by Firebase, allowing occupational therapists to securely access the dashboard. Each participant within the system is assigned unique IDs linked to key elements: Home, Seats, and Studies. This structure provides a comprehensive framework for therapists to create, update, delete, and manage participants, seats, and related studies directly from the application, with all data stored and synchronized in InfluxDB for long-term access and analysis.
The dashboard also includes a data visualization component to display time-series data from sensors installed in each SmartSeat. Therapists can view trends related to movement, activity levels, and other metrics over time. Additionally, the system is designed to monitor the health status of each seat, such as battery levels and data reports. While real-time synchronization with seat sensors is still under development, temporary data has been integrated to simulate these features, ensuring the interface is functional for future live synchronization.
Development
When I was introduced to the concept at the start of the internship, I began by creating wireframes and a low-fidelity prototype of the dashboard. This was essential for facilitating conversations with the end users occupational therapists to understand their needs, explore potential features, and define the end goal of the project. Since this is a research-focused program, the initial design was not set in stone. We adopted an iterative process, refining the dashboard design through continuous feedback and experimentation to ensure it aligned with the therapists' expectations.
Following the design phase, I independently took on the development of the dashboard’s frontend components and features to bring the app to life. During this phase, I collaborated with stakeholders to gather examples and insights on how we wanted to visualize the data effectively. This feedback guided the creation of interactive and meaningful visual components for the dashboard while keeping reactivity across all screen types.
On the backend, I developed the Flask API to manage the CRUD operations for key elements such as Home, Participant, Seat, and Study IDs. These operations ensured seamless communication between the dashboard and InfluxDB, where all relevant data is stored and accessed.
Currently, I am working on graphing and visualizing data using historical trial data stored in InfluxDB. These visualizations are being integrated with Grafana to embed interactive graphs into the dashboard, allowing users to analyze seat performance, movement patterns, and health metrics. The goal is to prepare the system for live synchronization with the sensors, ensuring the dashboard reflects real-time data and insights once the integration is complete.
Future Improvements
The next phase of the project involves optimizing the embeded graphs and visualizations displayed on the dashboard. We are currently using previously collected trial data from the database to ensure the visual elements are clear, informative, and user-friendly. This step is crucial to provide actionable insights for occupational therapists as they monitor patient progress and seat performance.
Once the studies go live, the system will transition to synchronizing real-time data from the deployed seats. This will ensure the dashboard reflects the most up-to-date information on sensor readings, battery levels, and patient movement. We aim to maintain an ongoing dialogue with occupational therapists throughout this phase to ensure the data integration meets their needs.
Additionally, I will assist therapists with onboarding and setup to ensure they can effectively use the system. This continuous support will help address any challenges they encounter and allow us to gather feedback for further refinement and improvements as the project evolves.
Learn more about the project here.